
We just finished a math project that really caught the kids’ attention. We did a statistical analysis of standard size bags of m&m’s candies. The company claims that there are a certain percentage of each color of m&m’s in each standard sized bag. We used this packet to test the claim and they turned out amazing!
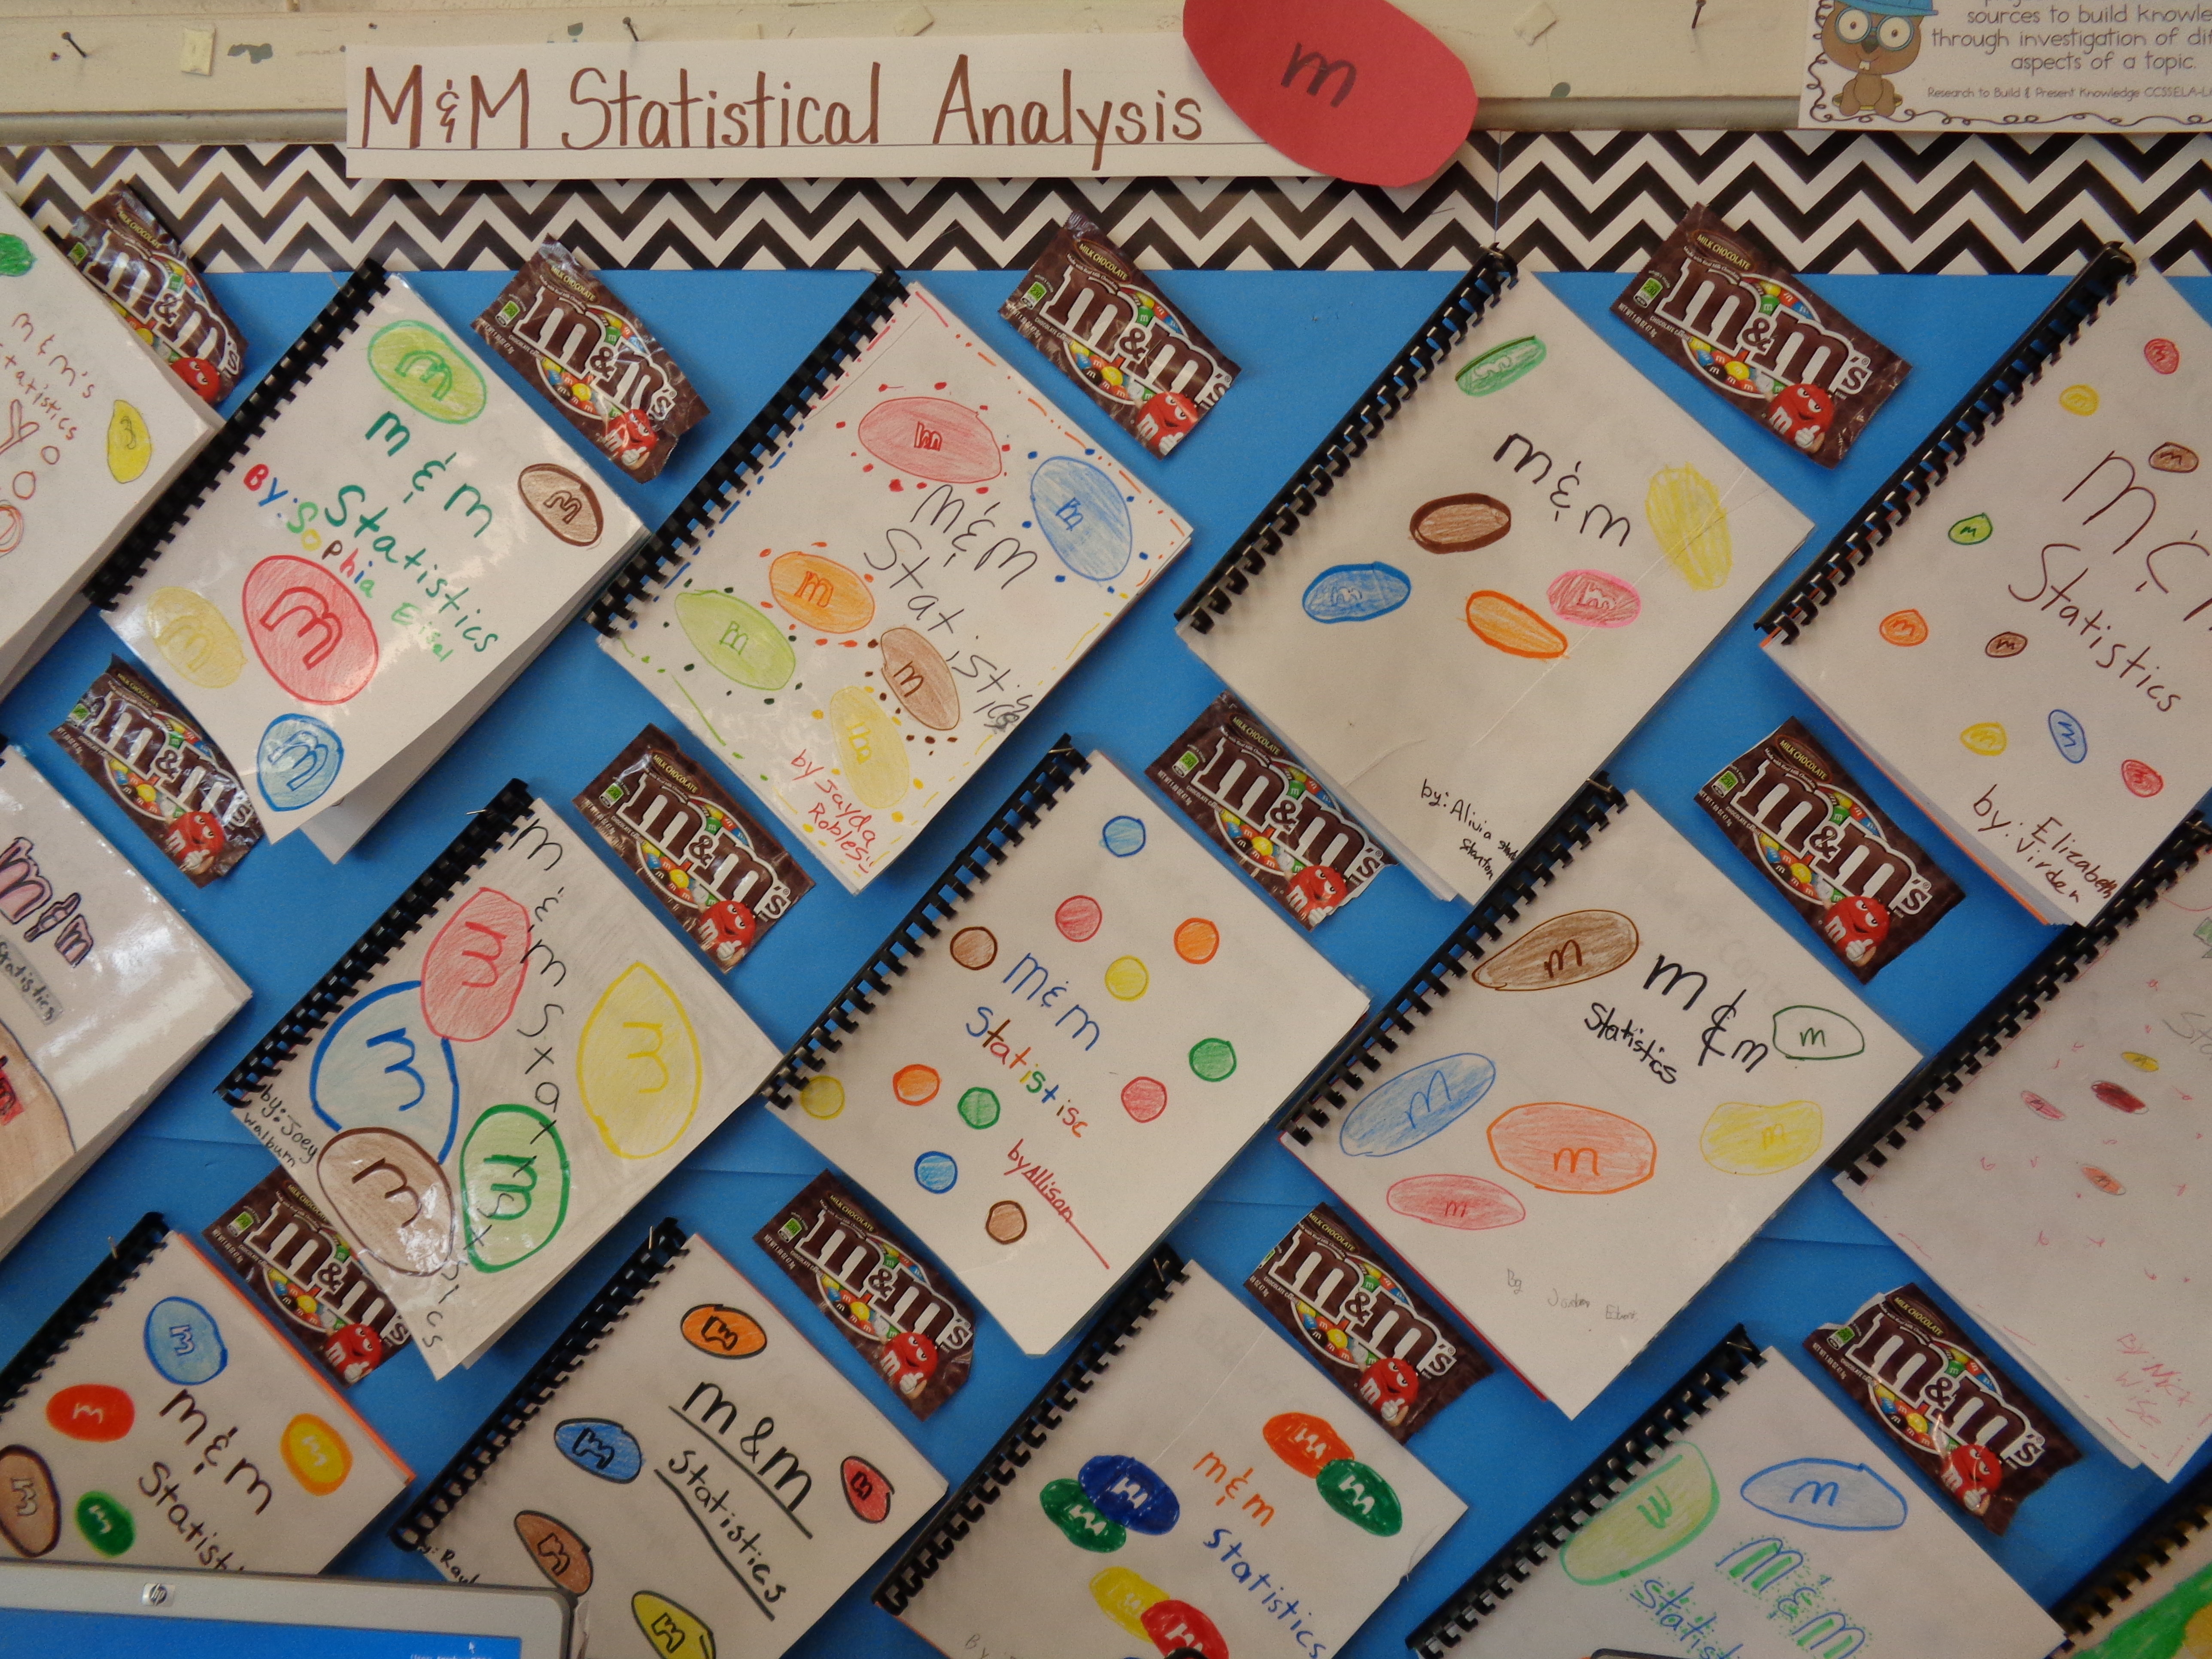
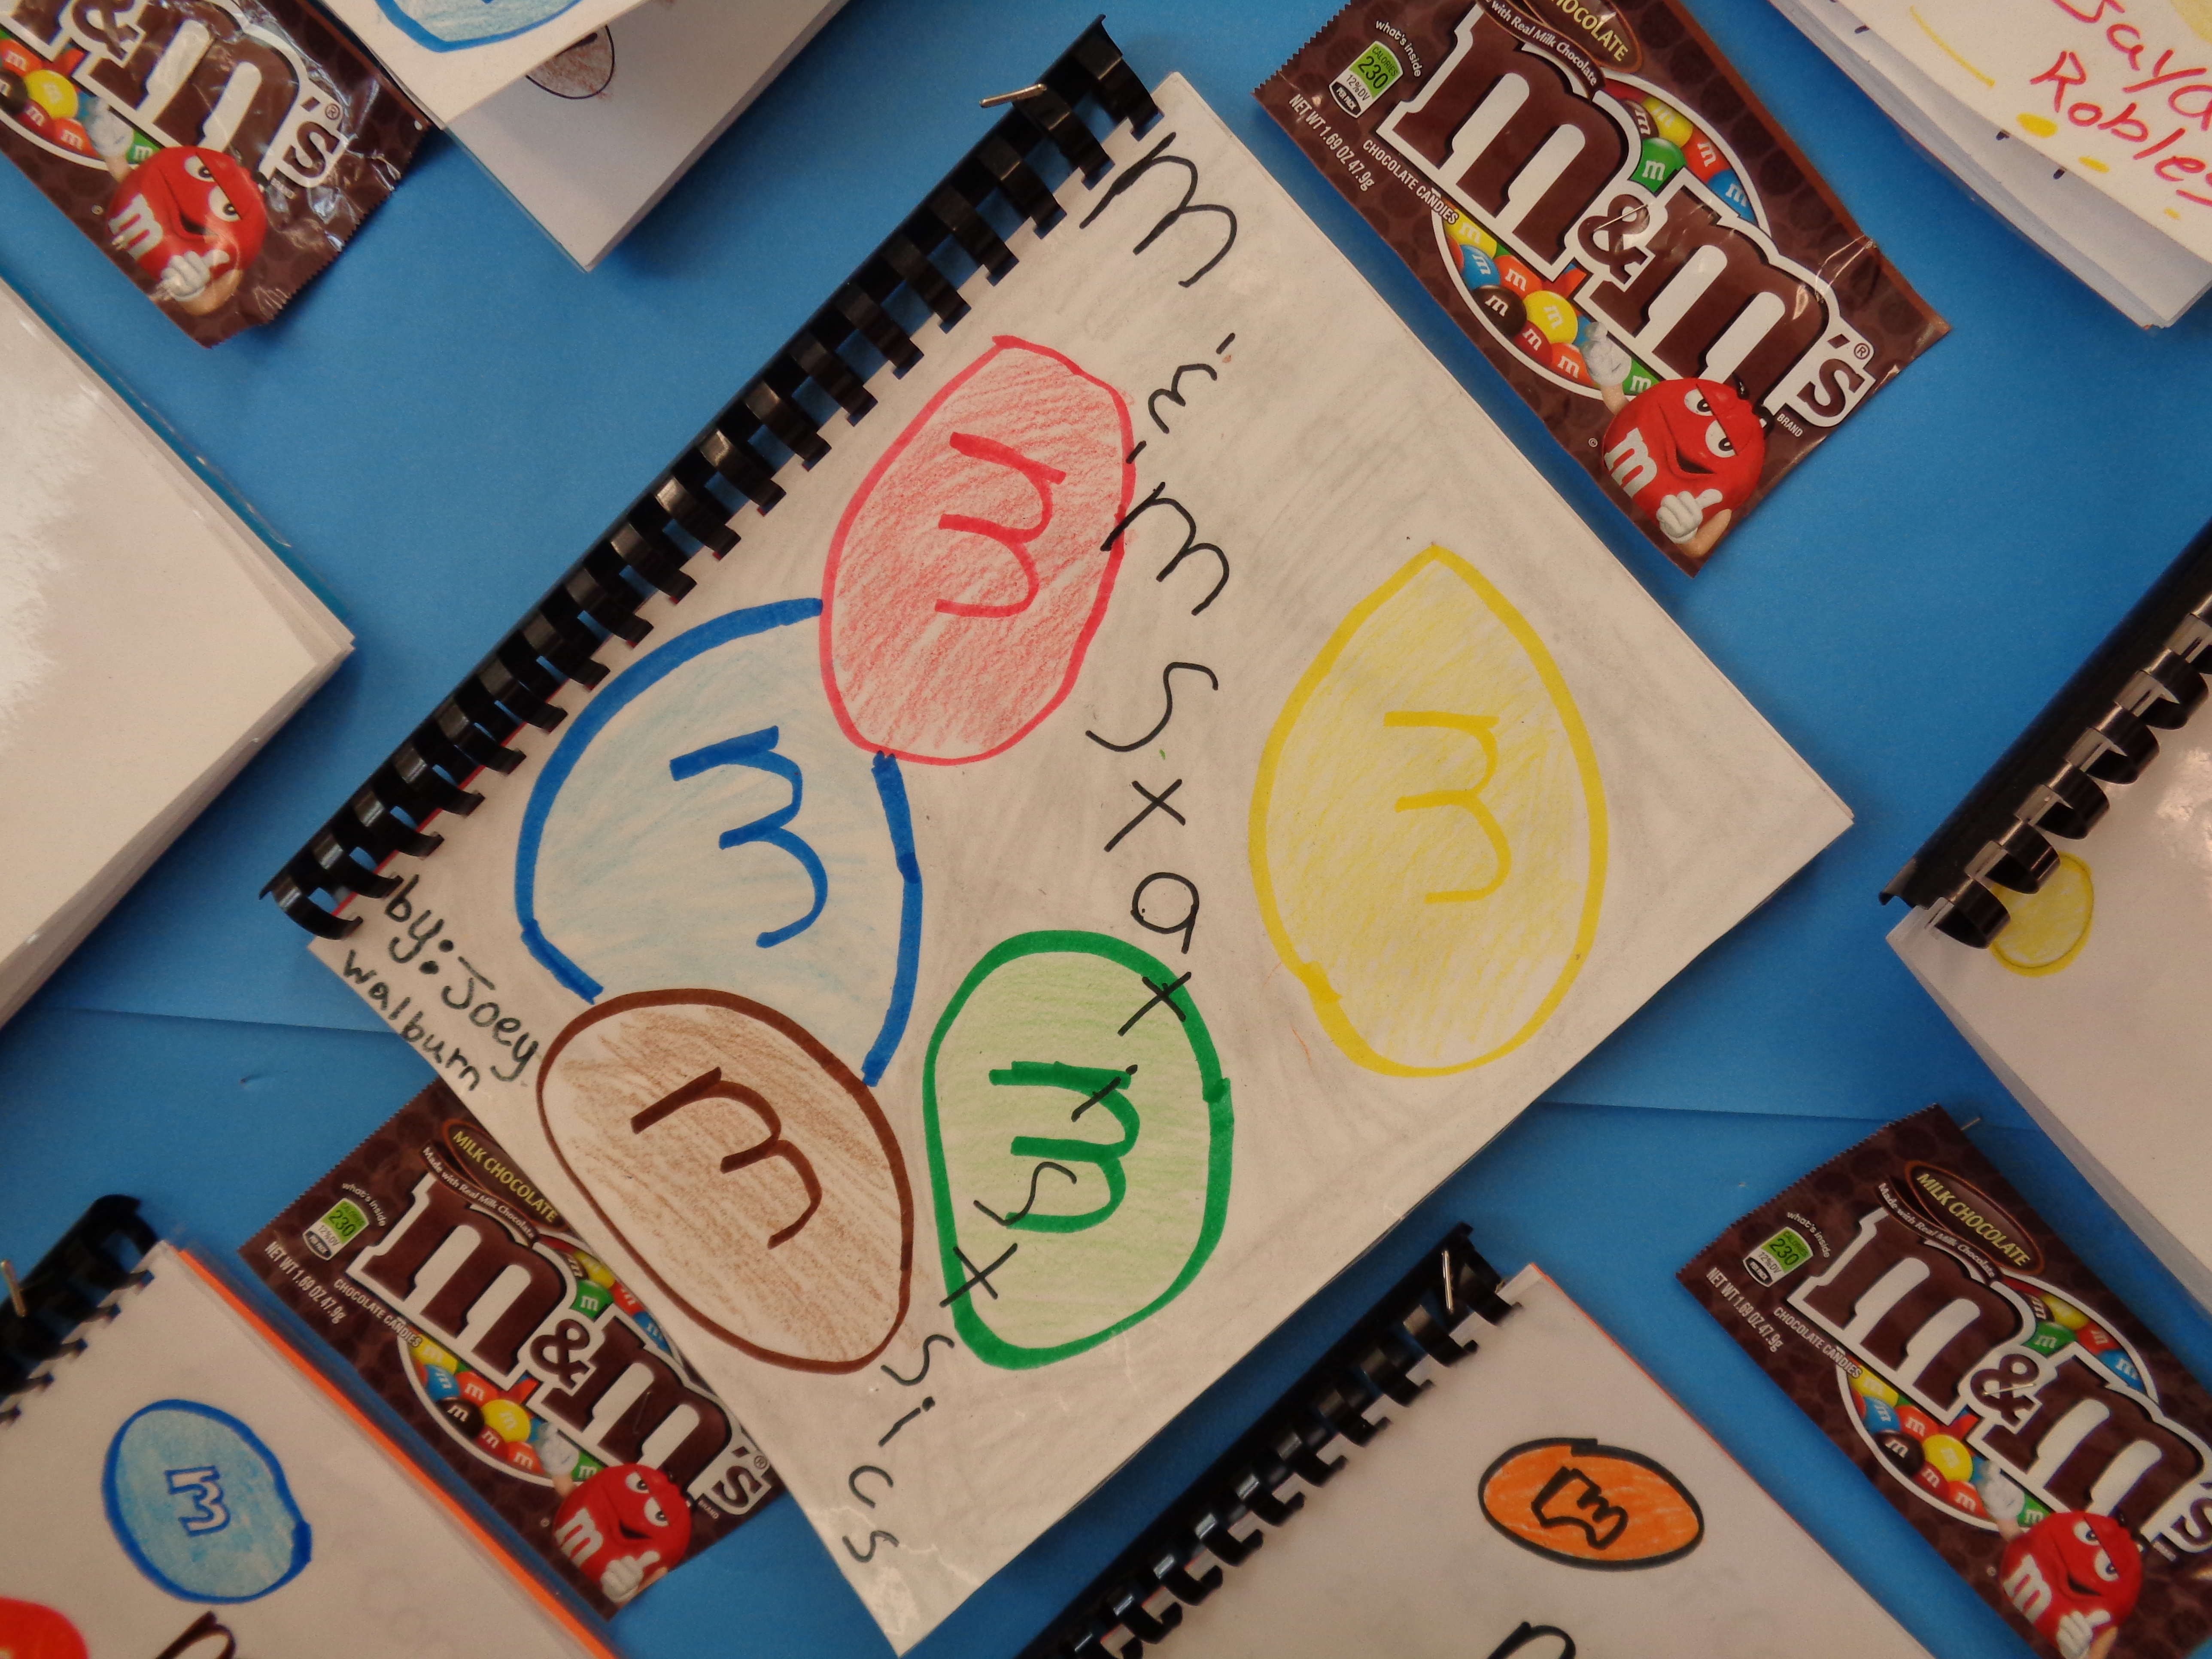
We compiled all of our work into a spiral bound report. They look great hanging up in the room. Here is the packet on TpT if you are interested (it is $4).

The packet covers pictographs, bar graphs, circle graphs, data landmarks, converting fractions to decimals to percents, and more! This is a great way to make a real-world connection with math!
